Gold: Tactical Assessment
September 29th, 2007Warning: This is not a recommendation to buy, sell or hold any financial instrument.
Since many of you won’t know your stochastic from your MACD, I’m going to summarize this right at the beginning.
Summary: Use extreme caution if considering adding to long gold positions in the near term. There is a strong possibility of a pullback. If you are looking to lock in profits, tighten stops, or consider a stop target of $738. Consider long entries under $738 but over $721. Under $721, consider long accumulation using range strategies.
Now, for you squiggly lines, chicken entrails and Magic 8-Ball people, let’s look at recent hourly and daily gold charts.
As all traders know, stochastics and RSI can go extreme for days, or whatever interval the little voices in our heads tell us to pay attention to. But while I don’t know of a good way to know when the reversal will actually happen during these weird times, I very rarely take extreme band trades in the direction of the trend. The exception is momentum piling on after a major support or resistance breech. And I don’t hold those for long. Why? Going long with stochastics over 80 is for thrill seekers, maniacs and people who know something. Most of the time, I don’t fall into any of those categories.
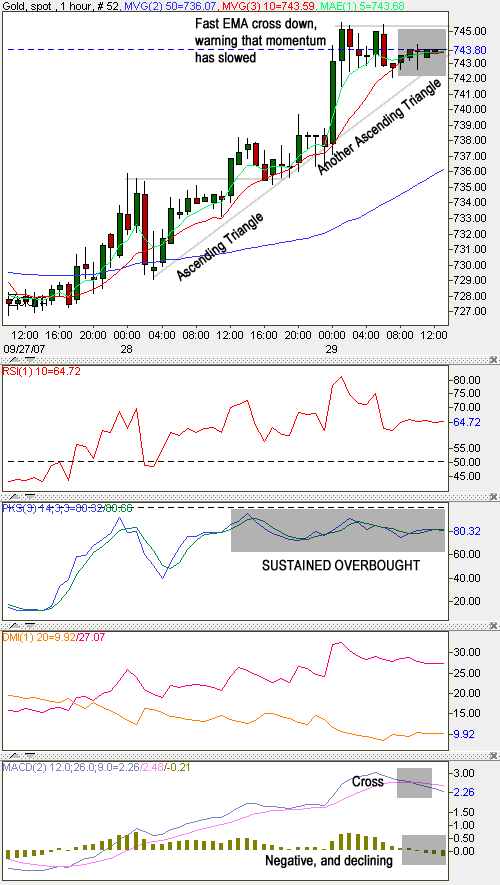
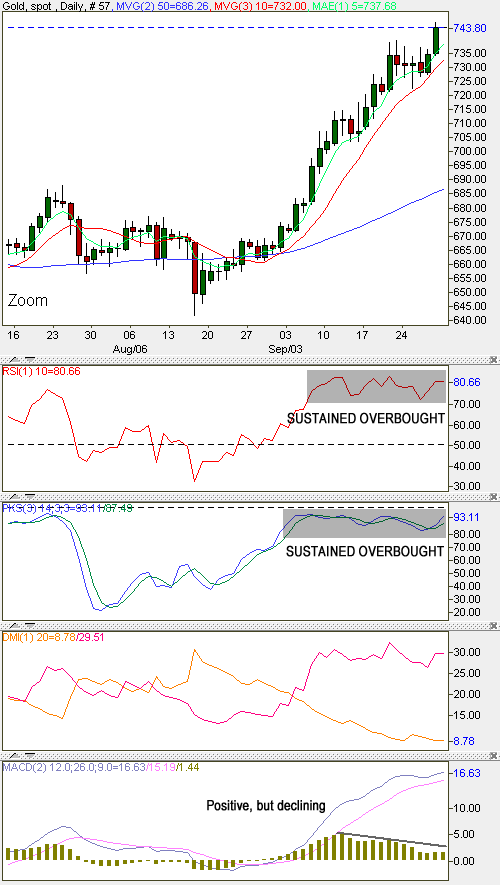
We’ve had 1 hour and daily stochastics in extremes for days. RSI, same thing on daily. RSI hourly hit extreme levels and pulled back.
But this is why I decided raise the blood pressure of gold bug technicians this weekend: I don’t like that one hour MACD cross at all, or the negative slope, or the fact that it has gone below the zero line. On daily, the negative slope has my attention because I know hourly has already broken down. Is it just taking a breather?
With stochastics and RSI indicators in whacked-out, overbought states, guess what’s hanging overhead? The nice fat $750 resistance.
“But, Kevin, aren’t ascending triangles your favorite setup?”
Yes, BUT not with 1 hour MACD crossing down, along with RSI and stochastics in whacked out overbought states… I like ascending triangles, but I’m no chainsaw juggler.
Guys, like I said, I don’t know anything and gold could blow through $750 like a hot knife through butter, but going in heavy here would be VERY VERY risky.
I general, for me, the acme of skill in trading is buying dips during uptrends and shorting peaks during downtrends.
Gold is in a strong uptrend in all meaningful intervals (Look at that powerful DMI), but the move has gone extreme in the short term. If you feel as though you must play these extreme bands, consider going in with less, to capture the move if They squeeze it above $750. That could happen. I think, however, that there’s a much better chance of being able to get a better entry closer to $721, during a nice consolidation period closer to those longer interval moving averages.
“But how close to $721?”
In strong uptrending markets, your stochastics often won’t get down below 20. Consider believing 1 hour stochastic cross up under 60 with $721 intact. Want a more traditional stochastic play? Shorten your interval and you’ll get more juice under 20.
While I’m providing relatively narrow targeting guesses, you should also know that I’m not trading this. I buy very small amounts during dips. I’m not selling because I strongly suspect that we have seen NOTHING in terms of the banking chaos yet.
I just hate botched entries. From years of trading, I learned to wait for quality entries. So, in that regard, I can’t help myself. While I might be thinking like a trader, all I’m doing is buying the dips and laughing when it goes down, because I get to buy more lower.
It sounds nuts, but you’ve got to have an almost playful attitude with this crap. If looking at those charts causes your stomach to turn and your pulse to quicken, you’re in too heavy, you’re not diversified enough and you’re setting yourself up for serious pain.
As always, diversification, diversification, diversification.

Recent gold chart, one hour interval

Recent gold chart, one day interval

thanks for the detailed analysis, kevin.
great article, thanks kevin.
i agree that buying at these prices would be pretty dangerous. i also agree that you cannot discount the possibility of blowing straight through $750. bottom line is, it’s a good time to already be well positioned 😉
i don’t have charts with stochastics, but the silver chart to me looks much uglier in the say short/midterm time range. eg the one and two year charts here:
http://www.kitco.com/charts/techcharts_silver.html
is there a place to get gold/silver charts with stochastics that is free?
thanks again. -s
this gold chart is nice too:
http://www.the-privateer.com/chart/gold-pf.html
i think a retracement to $675 or $700 would not be surprising.
Free, decent charting for the currencies, gold, silver and USDX:
http://www.netdania.com/ChartApplet.asp