Energy Conflicts and Differential Profits: Poor Performance of Oil Stocks Predicts Middle East Conflicts
February 19th, 2008Via: Alternative Information Center — Economy of the Occupation 10: Cheap Wars:
The key beneficiaries of this new, indirect link are the large oil companies. The geographic centre of this process is the Middle East. After the Vietnam War, the Middle East has become the hot spot of global conflict, with obvious corollaries for the price of oil. The relationship between these conflicts and the differential profits of the oil companies, however, has received little or no attention.
The reason for this neglect is not difficult to see. Most analyses of Middle-East conflict and oil are situated in the disciplinary intersection of ‘international relations’ and ‘international economics.’ Their basic reasoning boils down to a struggle among states over raw materials. On the one hand, there are the industrialized countries that need cheap oil in order to sustain their growth and expanded reproduction. On the other hand there are the countries of the Middle East , organized through OPEC, whose intention is to extract from the process as much rent as they can. This broad conflict is complicated by various factors: for example, inter-state rivalry—say between the United States and the Soviet Union (previously) and Europe and Asia (presently); religious and ethnic hostilities in the Middle East itself; or the interests of various sectors and capitalist fractions in the industrialized countries.
In this polemic of high politics and resource economics, few have bothered to break through the aggregate front, fewer have done empirical work, and almost no one has dealt with the question of how exactly accumulation by the oil companies fits into the picture. Figure 2 offers a glimpse into what is missing from the story. The chart shows the history of differential accumulation by the ‘Petro-Core’ of leading oil companies—specifically: BP, Chevron, Exxon, Mobil, Royal-Dutch/Shell and Texaco.[6]
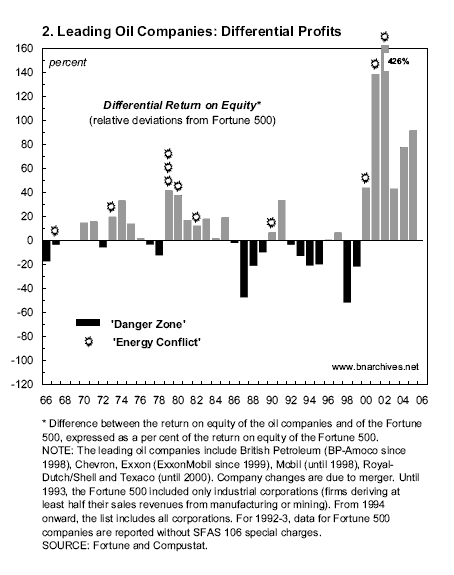
Each bar in the figure measures the difference between the rate of return on equity of these companies and the average rate of return on equity of the Fortune 500 benchmark (with the result expressed as a percent of the Fortune 500 average). The grey bars show years of differential accumulation; that is, years in which the leading oil companies beat the average with a higher rate of return. The black bars show periods of differential decumulation; that is, years in which the leading oil companies trailed the average. For reasons that will become apparent in a moment, these latter periods signal ‘danger’ in the Middle East . Finally, the explosion signs show ‘Energy Conflicts’—namely, conflicts that were related, directly or indirectly, to oil.[7] The figure exhibits three related patterns, all remarkable in their persistence:
First, every energy conflict in the Middle East was preceded by a danger zone, in which the oil companies suffered differential decumulation.
Second, every energy conflict was followed by a period during which the oil companies beat the average.
And, third, with only one exception in 1996-7, the oil companies never managed to beat the average without an Energy Conflict first taking place.
