Bloggers of Mass Destruction
February 2nd, 2008Via: Daily Herald:
It’s the government’s idea of a really bad day: Washington’s Metro trains shut down. Seaport computers in New York go dark. Bloggers reveal locations of railcars with hazardous materials. Airport control towers are disrupted in Philadelphia and Chicago. Overseas, a mysterious liquid is found on London’s subway.
And that’s just for starters.
Those incidents were among dozens of detailed, mock disasters confronting officials rapid-fire in the U.S. government’s biggest-ever “Cyber Storm” war game, according to hundreds of pages of heavily censored files obtained by The Associated Press. The Homeland Security Department ran the exercise to test the nation’s hacker defenses, with help from the State Department, Pentagon, Justice Department, CIA, National Security Agency and others.
The laundry list of fictional catastrophes — which include hundreds of people on “No Fly” lists suddenly arriving at airport ticket counters — is significant because it suggests what kind of real-world trouble keeps people in the White House awake at night.
Imagined villains include hackers, bloggers and even reporters. After mock electronic attacks overwhelmed computers at the Port Authority of New York and New Jersey, an unspecified “major news network” airing reports about the attackers refused to reveal its sources to the government. Other simulated reporters were duped into spreading “believable but misleading” information that worsened fallout by confusing the public and financial markets, according to the government’s files.
The $3 million, invitation-only war game simulated what the U.S. described as plausible attacks over five days in February 2006 against the technology industry, transportation lines and energy utilities by anti-globalization hackers. The government is organizing another multimillion-dollar war game, Cyber Storm 2, to take place in early March.
Weekly Gold Chart Has Formed a Shooting Star… or Something
February 2nd, 2008WARNING: This is not a recommendation to buy, sell or hold any financial instrument.
There was a change of circumstances between the time I wrote this post and the close of trading on Friday. Remember how grim things were looking for the dollar, and how well gold was doing?
Don’t ask me how, why, who? I don’t know, but the dollar rallied into the weekend.
Of course, what do I do after I say that I’m not going to look at the gold charts anymore? That’s right, I brought up a weekly chart to see if I could find anything interesting; to see if that hard dollar rally “painted” anything weird on the gold chart. It’s Friday, so that session closes out the week and prints a weekly candle that all traders will look at.
What I found was… Quite weird.
Many technicians are going to look at that weekly chart and gasp, “Oh my! Gold just put in a Shooting Star on the weekly chart!” The Shooting Star is a key reversal pattern, possibly indicating a top. Yep. By golly, there it is, complete with accompanying high band stochastics and RSI.
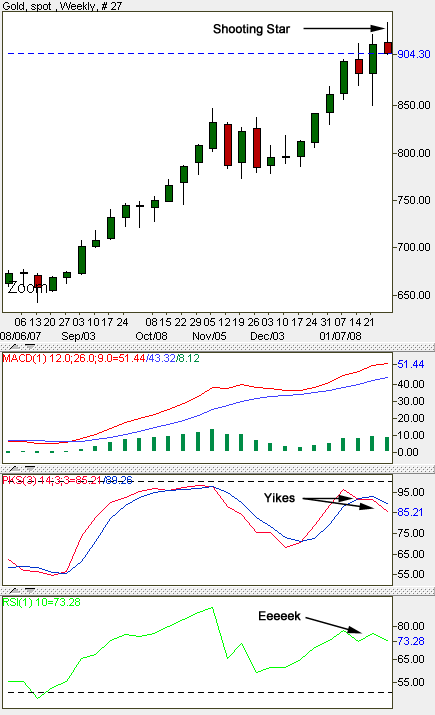
Weekly gold
Indeed, “Shooting Star” is what I would think if I didn’t smell a rat from that dollar rally. But look at the intraday action from last week as four hour candles. Notice how the body of the negative candle FOR THE ENTIRE WEEK is created in a single four hour period! On Friday.
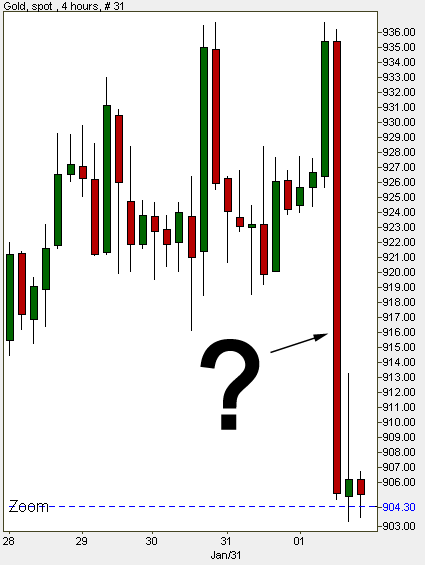
Intraday gold, 4 hour interval
Man, if I didn’t already have a Coincidence category on Cryptogon, I’d be adding it for this post!
Are there organizations out there that can paint a Shooting Star on a weekly gold chart? I would like to think not. (Of course, if you’re a regular Cryptogon reader you probably just snorted and spit some of your cocktail onto the screen.) But look at that 4 hour interval chart and explain to me what happened on that candle, before the weekend. I looked at it on a five minute chart and the majority of the move happened in 25 minutes. That really, really makes me wonder if someone is desperate to stop this rally. And I mean DESPERATE. They didn’t go about it in a smart way. They didn’t fade highs and slowly and subtly knock it down over time. They didn’t do it in a way that would get the sheep to make the move dynamic. But look how perfect that Shooting Star is…
I’m not selling my gold anytime soon. I don’t care if They paint Satan with two horns and a pitchfork on that chart.
More: Straight Technical Analysis
I’m going to swap my tin foil trader hat for my straight technical analysis hat.
Looking at the daily and weekly stochastics, gold looks ready to retest supports UNDER $900.
The MACDs in several intervals have formed a downward trending, multilane highway. (It is important to note that the weekly MACD is still headed up.) With the daily and weekly stochastics crossed down from extremes, it looks like more short term downside is likely.

Gold MACDs in several intervals
Buying opportunities? I’m not necessarily saying to wait for daily and weekly stochastics to go under 20 (you could be waiting A LONG time on the weekly), but wait for them to unwind a bit. Look to believe a daily stochastic cross up under that 50 fib fan line but above the 61.8 fib fan line, from $875 to $890.
Longs will want to see $875 kept intact, which also happens to be near the 61.8 fib fan line.
Below $875, I’d hold off, hoping it get it closer to $850, which is THE support of supports.
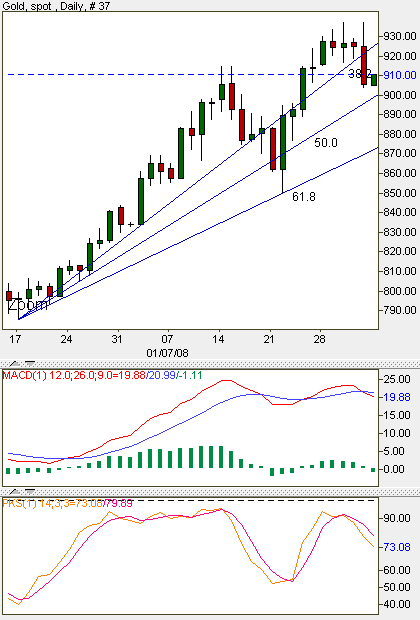
Gold, daily interval
If it does bounce off $900, should you believe it?
It’s a tough call, but with daily and weekly stochastics crossed down, I’d have to say no. I probably would not add more until stochastics unwound some more. I’d believe a bounce off $900 once it crosses $936. HA
On a longer term, weekly chart, the move is fully intact, with MACD headed higher. It seems silly to even split hairs about the day to day noise when you look at that weekly chart over years…
For now, expect some shorter term pullbacks with weekly stochastics crossed down from extremes.
I cannot, however, recall looking at any issue with a more significant support than the $850 level on gold. If it can manage to get back down into that zone, $850 is a strong support. Just know that at $844, gold longs would have some hard decisions to make. Not me, though, because, as you know, I’m not selling.
Not-Based-On-Anything-Gut-Feeling: More and more people will simply be buying any pull backs and to hell with these charts.
Third Undersea Internet Cable Cut in Mideast
February 2nd, 2008I spent some time this evening trying to get a better idea of what this information warfare campaign is all about. (Anyone who tells you that this is some sort of fluke is a f*@$^!& idiot, and that’s being kind.)
Remember the Iranian Oil Bourse?
This is from January 4, 2008:
Iran Oil Bourse to deal blow to dollar
Fri, 04 Jan 2008 20:45:41
The long-awaited Iranian Oil Bourse, a place for trading oil, petrochemicals and gas in various non-dollar currencies, will soon open.
Iran’s Finance Minister Davoud Danesh-Jafari told reporters the bourse will be inaugurated during the anniversary of the Islamic Revolution (February 1-11) at the latest.
“All preparations have been made to launch the bourse; it will open during the Ten-Day Dawn (the ceremonies marking the victory of the 1979 Islamic Revolution in Iran),” he said.
The Minister had earlier stated that the Oil Bourse is located on the Persian Gulf island of Kish.
Some expert opinions hold inauguration of the bourse cold significantly devalue the greenback.
—
Maybe that’s it, maybe not. But it makes a hell of a lot more sense than the legend about the ship anchors.
Via: CNN:
An undersea cable carrying Internet traffic was cut off the Persian Gulf emirate of Dubai, officials said Friday, the third loss of a line carrying Internet and telephone traffic in three days.
Dubai has been hit hard by an Internet outage apparently caused by a cut undersea cable.
Ships have been dispatched to repair two undersea cables damaged on Wednesday off Egypt.
FLAG Telecom, which owns one of the cables, said repairs were expected to be completed by February 12. France Telecom, part owner of the other cable, said it was uncertain when repairs on it would be repaired.
Stephan Beckert, an analyst with TeleGeography, a research company that consults on global Internet issues, said the cables off Egypt were likely damaged by ships’ anchors.
The loss of the two Mediterranean cables — FLAG Telecom’s FLAG Europe-Asia cable and SeaMeWe-4, a cable owned by a consortium of more than a dozen telecommunications companies — has snarled Internet and phone traffic from Egypt to India.
Officials said Friday it was unclear what caused the damage to FLAG’s FALCON cable about 50 kilometers off Dubai. A repair ship was en route, FLAG said.
Eric Schoonover, a senior analyst with TeleGeography, said the FALCON cable is designed on a “ring system,” taking it on a circuit around the Persian Gulf and enabling traffic to be more easily routed around damage.
Schoonover said the two cables damaged Wednesday collectively account for as much as three-quarters of the international communications between Europe and the Middle East, so their loss had a much bigger effect.
The 2007 International Privacy Ranking
February 1st, 2008The U.S., Britain, China, Russia: All have the worst possible ranking for privacy.
Via: Privacy International:
In recent years, Parliaments throughout the world have enacted legislation intended to comprehensively increase government’s reach into the private life of nearly all citizens and residents. Competing “public interest” claims on the grounds of security, law enforcement, the fight against terrorism and illegal immigration, administrative efficiency and welfare fraud have rendered the fundamental right of privacy fragile and exposed. The extent of surveillance over the lives of many people has ow reached an unprecedented level. Conversely, laws that ostensibly protect privacy and freedoms are frequently flawed – riddled with exceptions and exceptions that can allow government a free hand to intrude on private life.
At the same time, technological advances, technology standards, interoperability between information systems and the globalisation of information have placed extraordinary pressure on the few remaining privacy safeguards. The effect of these developments has been to create surveillance societies that nurture hostile environments for privacy.
Governments have created hundreds of key policy initiatives that, combined, may fundamentally destabilize core elements of personal privacy. Among these are proposals for the creation across society of “perfect” identity using fingerprint and iris scanning biometrics the linkage of public sector computer systems, the development of real-time tracking and monitoring throughout the communications spectrum, the development of real-time geographic vehicle and mobile phone tracing, national DNA databases, the creation of global information sharing agreements and the elimination of anonymity in cyberspace.
The potential for engagement of these developments is currently limited to a marginal response. The problem for civil society – or indeed anyone wishing to challenge surveillance – is not simply the sheer magnitude of the threat, but also its complexity and diversity.
It is important for each country to decide rationally and openly which element of personal privacy should be lost, but it is also important for each country to understand how far down the path of mass surveillance it has travelled. It is for this reason that we have undertaken the rankings project.
The ranking assess the key areas of surveillance and control, and will identify mechanisms of protection that have failed to operate according to the letter and spirit of the national and international privacy protections. It will concentrate on policy development issues, inadequacies in the consultation process, legal protections (or lack of them), the impact of surveillance on democratic institutions, changes to the nature of society and the implications for individual freedoms and autonomy.
The New American Gentry
February 1st, 2008I find it interesting that this meme is being driven simultaneously in the U.S. and Britain. (See the post below.) I wonder why? No, seriously. I’m not being sarcastic. I really do wonder why?
Are stories like these peer-to-peer warnings for rich people? Get out of your urban bubble bombs before they implode?
Via: Wall Street Journal / Yahoo:
The word “gentrification” conjures up images of once-poor urban neighborhoods invaded by cappuccino bars and million-dollar condos. Now, broad swaths of rural America — from New England to the Rocky Mountain West — are being gussied up, too.
Affluent retirees and other high-income types have descended on these remote areas, creating new demand for amenities like interior-design stores, spas and organic markets. For many communities, it’s the biggest change since the interstate highway system came barreling through in the 1960s and 1970s.
With the Internet allowing people to work from almost anywhere, the distinction between first and second homes has become blurred. Many people are buying retirement property while they’re still employed. Millions of soon-to-retire baby boomers, say demographers, will propel this trend for years to come.
“What we’re seeing is a class colonization,” says Peter Nelson, an associate professor of geography at Middlebury College and an expert on rural migration. “It really represents a shift in the nature of the economy from a resource-extraction economy to an aesthetic-based economy.”
Such change can create social tensions, as longtime residents are either driven away because they can no longer afford housing or are forced to adapt to new careers.
The impact of rural gentrification is playing out in this lakeside town, situated roughly 100 miles from Boise in Valley County. For decades it’s been home to ranchers, farmers and timber workers. It has also served as a weekend retreat for residents throughout the state who flocked to Payette Lake for summer fishing and boating.
Today, Valley County is attracting newcomers from as far away as New York and Sydney. They’re putting up second and third residences costing well over $1 million — price levels once reserved for the few waterfront properties.
In recent years, developers have snatched up land for $100,000 an acre in some cases, or 40 times what it fetched as farmland. Though home prices here are declining as in other parts of the nation, houses still cost about 60% more than in 2004.
The Hedge Fund Manager Who Bought a Farm
February 1st, 2008Via: Times Online:
The cost of farm property looks likely to soar as traditional British “lifestyle farmers” are joined by multimillion-pound investors hurriedly moving their wealth out of stocks and shares and into farmland. Across the world, hedge fund managers, property developers and other investors are turning their eyes to places such as Russia, Argentina and Uruguay, where farms are thought to be underdeveloped and provide an opportunity to profit from the rising prices of staples such as wheat, barley and oil-seed rape.
Britain is likely to feel the effects because our farmland is cheap by Western European standards. Marc Duschenes, of the property company Braemar, hopes that the surge in grain prices will persuade hard-pressed British farmers to sell their land. Braemar aims to raise £20 million for its agricultural land fund. “We are speculating that commodity prices will feed through into higher land prices,” says Duschenes. Carter Jonas is quoting forecasts of prices increases of 10-15 per cent this year.
At the same time lifestyle farmers – typically City high-fliers – have become the largest group involved in buying British farmland. According to Mark Ashbridge, of Savills Private Finance, 40 to 45 per cent of farm purchases are now made by lifestyle farmers. Knight Frank puts the figure at 38 per cent, with only 32 per cent of farm purchases by “genuine” farmers. Institutional investors (11 per cent), agribusiness (11 per cent) and developers (6 per cent) account for the rest of the purchases, Knight Frank says. This mounting interest, combined with a shortage of supply, has meant increases of up to 40 per cent in the price of UK farmland in 2007.
UK: Secret Bank Rescues to Be Allowed
February 1st, 2008WARNING: This is not a recommendation to buy, sell or hold any financial instrument.
Sterling holders, do you get it yet? (Some of the sterling holders on Cryptogon do. Sterling holders have made up the biggest component of BullionVault purchases in January.)
Via: BBC:
Chancellor Alistair Darling is to give new powers to the Bank of England to mount secret rescue operations for banks requiring emergency funds.
The plan will be unveiled today as part of sweeping regulatory reforms designed to prevent a repeat of the Northern Rock debacle, the BBC has learned.
He will also make the Bank of England’s loans to a troubled bank rank first in the queue of creditors.
There will be a 12 week consultation period on the new legislation.
“It’s unclear whether the devastating run on the Rock could have been prevented by the kind of clandestine help which the Bank may in future be able to provide,” said the BBC’s business editor Robert Peston.
“Such secrecy would only apply where such emergency lending is temporary and limited in nature.
“So the Treasury believes that the Rock probably needed too much money for too long for the Bank of England to be able to keep the rescue operation out of the public domain.”
U.S. Dollar Falling Down; USDX Under 75
February 1st, 2008WARNING: This is not a recommendation to buy, sell or hold any financial instrument.
“The strategic view still looks promising for dollar bears.”
—A Look at the U.S. Dollar Index, January 17, 2008
Yeee HA! Lean over you pig. Leeeeeeeeeeaaaan! For dollar bears/foreign currency holders: It’s got to take out 74.50 on the downside, though. That’s the all time low. See my mid January analysis on this for more detail on what lies ahead. * chuckle *
And gold is behaving with a shocking gap up. Nice. (I don’t look at the gold charts anymore. Seriously. I don’t. I’m not trading it. Why look at it?)
The resistance on EUR/USD is 1.4967, FYI.
I love it when a plan comes together as much as the next well positioned Cryptogon crash trader, but keep your eye on the action on the dollar. We’re just under 75 now on the U.S. Dollar Index, that’s gooooooood! But we don’t want to see a double bottom on 74.50. Say it with me now! No bounce off 74.50.
I’d be handling snakes and speaking in tongues if I thought it would help that thing take out 74.50. Well, there are no snakes in New Zealand. Does possum count?
Via: Bloomberg:
The dollar fell, headed for its biggest weekly decline in a month against the euro, as traders bet the Federal Reserve will cut interest rates again to avert a recession.
The dollar dropped versus 15 of the 16 most-traded currencies this week, falling the most against the Australian and New Zealand dollars. Growth in U.S. payrolls probably accelerated in January from the weakest pace in more than four years, while staying at a level that indicates a softening job market, economists said before a government report today.
Sold-to-Close: DIA Call Options Strike 133 @ .20
February 1st, 2008WARNING: This is not a recommendation to buy, sell or hold any financial instrument.
How could it possibly go up? Right? With every media source saying we’re in recession and the world is ending, doom, etc… I mean, sure, maybe it is The End.
But, then again, maybe not.
…
I have this thing about being upwind when the media starts a fire. When things look so totally obvious, and the mainstream media is in on it, I just go the other way.
—EMERGENCY: GLOBAL FINANCIAL MARKETS COLLAPSING
Remember those DIA calls that I bought back when the blood was flowing in the streets… I paid .05 for them.
My GTC sell order got taken out at .20 during yesterday’s session. I’m not bragging. I’m worried about those of you out there in Internet land who might be thinking about playing or sticking with DIA long.
I’m going to explain the technical arguments for why this move looks like it might continue, and then the reason why I pulled the plug.
Truth be known: I would have tried to let it ride (after all, this is the options lotto), but my PBW calls (strike 29) aren’t doing so hot. I paid .05 for those and that’s pretty much where they sit. Expiration is still a couple of weeks out, though. I figured I’d take profit on the DIA calls in case the PBW calls don’t work. Bird in the hand… Pigs get slaughtered. Nobody ever went broke taking profit. Etc.
Now, if you were insane/smart/reckless/in-the-know enough to buy calls down there, when the panicked herd was selling everything that wasn’t bolted down, letting greed win out over fear right here might be justified. That is a BIG FAT—might.
Obviously, I considered the following argument myself, but took profit anyway. Let’s be clear: I’m completely out. But, I’ll consider buying puts soon if the daily squiggly wigglies go extreme overbought.
Ok, so here are the arguments for sticking with DIA long:
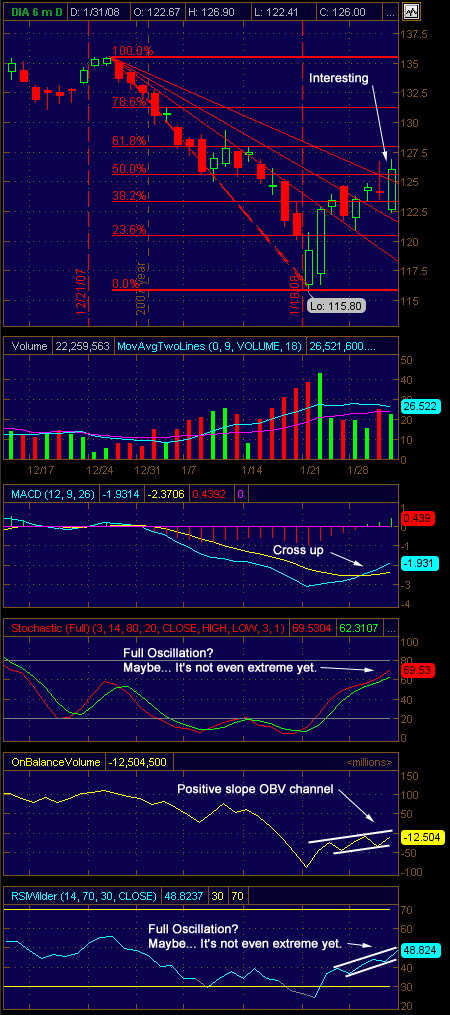
Squeeze
* There is a daily green candle close above the fib fan AND the 50% fib retracement grid line. Did They paint that candle to get the shorts to give up? I have no idea, but shorts probably needed a change of shorts as they watched that thing develop.
* Daily MACD has crossed up and is diverging, indicating increasing momentum.
* Daily stochastics might be going for a full oscillation, and the oscillator isn’t extreme yet (just under 70).
* Same with daily RSI at 48.8.
* OBV has formed a channel with a slightly positive slope. If I was holding out long, I would want to see that OBV slope a bit steeper. (OBV is one of my favorite indicators, by the way. The volume studies are the key ingredient to the special sauce, I’m pretty sure.)
Now, I don’t know if it’s a deal breaker just yet, but I don’t like how those MAs I’ve applied to the volume are coming back together. If I’m in a trade, I want to see increasing volume with a net flow my way. I know, I apply MAs to my volume. I’m weird that way. This chart leaves a bit to be desired, in terms of believing the volume, even with OBV showing a positive slope. Never mind, of course, that this bounce is an absurd, sucker baiting, whipsaw, clock-cleaning-waiting-to-happen farce. But, bet against short squeezes at your peril.
Remember what I said about buying those calls? Actually, I quoted Blade Runner:
“I’ve seen things you people wouldn’t believe.”
It’s because I know the psychology of short squeezes. They lay on short squeezes when almost EVERYONE believes THE END of the world is upon us. Lots of “dumb money,” meaning retail investors (Their term, not mine), are taking in the meme payload of DOOM from media. Then They paint a few red candles by selling the futures… What do the sheep do? They read the idiot financial press and listen to the money honies and they think, “OH MY GOD, IT IS THE END,” and they sell.
At the bottom. Or a near term bottom.
Now, if I made 300% on that bet, sitting here in my underwear, try to imagine what They’ve made off of this racket! Personally, I doubt that They’ll be able to convince the sheep to go “bargain hunting” because the sheep are too busy worrying about very worrying things. My guess is that more upside will be about decapitating speculators who are playing what I think will ultimately turn out to be a dead cat bounce.
I buy during red candles. I sell during green candles. That’s why I cut my position loose right here. Don’t get me wrong, they could squeeze this thing until those 133s I bought are in the money, but I won’t regret getting out when I did. Here’s why: the reversals off of short squeezes are usually brutal, whip saw moves. They come on suddenly and there’s really no way to see them coming (that I’ve been able to find). That’s why I’m not waiting for stochastics and RSI to go extreme, because the wizards behind the curtain know that lots of slobs who are long still think this move has legs and that the slobs are thinking, a little more, a little more…
Thanks, Jack. I’ll take my .20, my cigarette butts and my bottle caps, but I’m splittin’.
Research Credit: Brad
Brad recommended ThinkorSwim for charts. Indeed, I can create some pretty weird charts with that thing, and get up to some of the antics I used to get up to on the professional platforms. I pull the trigger using TradeKing, because their prices are right, but their chart package blows (and that is kind understatement). Thanks, Brad! Anyway, I created the chart above with the ThinkOrSwim client.
City Sues Man for Canceling Trash Service
January 31st, 2008Via: Examiner:
A man who claims to have reduced his waste to nearly nothing out of concern for the environment now faces a lawsuit from San Carlos for canceling his garbage-collection service.
Eddie House, 53, says he was shocked when he was served with a lawsuit Sunday at his Cedar Street home.
The lawsuit, filed by San Carlos Deputy City Attorney Linda Noeske in San Mateo Superior Court on Jan. 22, seeks a permanent injunction forcing House to maintain garbage service. City officials are also seeking to recoup from House the costs of the lawsuit.
The lawsuit claims House broke the city’s municipal code requiring all residential, commercial and industrial properties to contract with Allied Waste for pickup at least once a week — a standard requirement in most cities, San Carlos Deputy City Manager Brian Moura said.
House says he stopped his service with Allied Waste about a year ago after realizing that his garbage cans were nearly always empty.
“It’s just me and my dog, so I don’t have a whole lot of garbage to begin with and I recycle everything,” he said.